A county-by-county interactive analysis of inflation-adjusted wages
Wisconsin is split.
A county-by-county analysis shows that while some residents are seeing real growth in their wages — 12% in Lafayette County, for instance, between 2019 and 2023 — others are falling behind the rise in prices.
For an increasing number of families in places such as Waukesha County — where inflation-adjusted wages are down almost 2.6% over the same period of time — that means there is no longer enough to put food on the table.
At first glance, wage growth in Wisconsin might appear strong. The change in average weekly private-sector wages from 2019 to 2023 was 21.6%, according to figures released by the Bureau of Labor Statistics. The statewide average was $972 per week in 2019 and rose to $1,182 by 2023.
But the high inflation that followed the pandemic has eroded much of those increases. The CPI-urban price index, a measure of inflation, grew 19.1% over the same period. Inflation-adjusted real wage growth in Wisconsin, which measures the change in how much one’s wages actually can buy, was only about 2.1% over that four-year period.

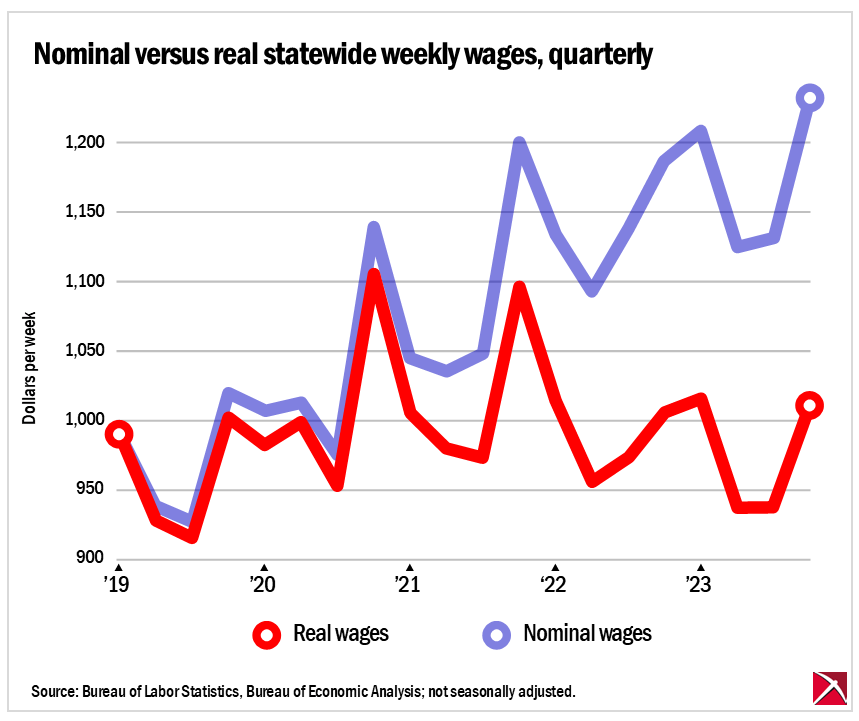
In other words, real wages have been almost flat over the past four years. Accounting for inflation, today’s weekly wages are worth about $993 in 2019 dollars.
Moreover, wage growth was not distributed evenly across the state. Some counties saw real wages grow faster than the statewide average, but others are falling behind the rise in prices.
The interactive map at the top of this story shows how real wages have changed across the state. Wages grew faster than the price level in counties depicted in red but fell behind prices in counties depicted in blue.
A total of 15 counties experienced a decline in real wages over the pandemic.
Jackson County fared the worst. Wages nominally increased from $858 to $943 per week, but when inflation is accounted for, real wages actually decreased by 7.7%.
Waukesha County was also among those where wages fell behind inflation. There, real wages decreased about 2.6%. That decrease in purchasing power has put working families in a difficult position.
Waukesha Food Pantry Executive Director Lindsay Johnson told the Badger Institute that since the pandemic, they’ve seen a steady increase in the number of clients making weekly visits. The total number of visits increased 68.7% from 56,268 in 2019 to 94,943 in 2023.
And in terms of visits per week, 2024 is shaping up to be even higher. The pantry saw about 1,825 visits per week in 2023. This year, that number has increased to about 1,916, based on year-to-date numbers.
“For a lot of our clients, it’s not just food inflation, it’s all inflation,” Johnson said. Clients often told her that their rent had increased or that medical expenses were too high, forcing them to look for food assistance. Increasing food costs are “just one more thing.”
Johnson said that for many families, the food pantry was “becoming part of their food plan.”
“A lot of our adult clients are working adults who aren’t making enough to feed their families,” Johnson said.
According to Johnson, the pantry sees as many as seven or eight new families enrolling every day. There’s also been an uptick in the number of larger families seeking assistance.
But it isn’t just working families: Johnson said that the increasing cost of food was also making it harder for the pantry to meet the needs of their clients.
“Our dollars aren’t going as far as they used to,” she told the Badger Institute. “We’re stuck.”
In 2019, the pantry made about $95,000 in food purchases. That number more than tripled to $293,500 in 2023.
For another seven counties, inflation-adjusted wages remained essentially constant, with less than 1% wage growth, including in Rock and Racine counties.
A total of 33 counties fared better than the state average, with real wage growth greater than 2.1%. Price, Vilas and Lafayette counties experienced 7.5%, 8.8% and 12.3% increases in real wages, respectively.
By far, the county with the most growth was Menominee. The county, which is coterminous with the Menominee Indian Reservation, saw wages go from $299 in 2019 to $688 in 2023. After accounting for inflation, real wages were still up 93% over the four-year period.
Wyatt Eichholz is the Policy and Legislative Associate of the Badger Institute. Any use or reproduction of Badger Institute articles or photographs requires prior written permission. To request permission to post articles on a website or print copies for distribution, contact Badger Institute President Mike Nichols at mike@badgerinstitute.org or 262-389-8239.
Submit a comment
"*" indicates required fields
The underlying data
| County | 2019 wages | 2023 wages | 2023 real wages | Real change |
| Adams County | 690 | 769 | 646 | -6.41% |
| Ashland County | 784 | 933 | 783 | -0.07% |
| Barron County | 762 | 904 | 759 | -0.38% |
| Bayfield County | 658 | 785 | 659 | 0.18% |
| Brown County | 993 | 1,179 | 990 | -0.30% |
| Buffalo County | 761 | 923 | 775 | 1.85% |
| Burnett County | 681 | 843 | 708 | 3.95% |
| Calumet County | 775 | 980 | 823 | 6.18% |
| Chippewa County | 804 | 982 | 825 | 2.56% |
| Clark County | 772 | 971 | 815 | 5.62% |
| Columbia County | 806 | 990 | 831 | 3.14% |
| Crawford County | 701 | 824 | 692 | -1.29% |
| Dane County | 1,120 | 1,370 | 1150 | 2.72% |
| Dodge County | 904 | 1,107 | 930 | 2.83% |
| Door County | 682 | 853 | 716 | 5.03% |
| Douglas County | 789 | 1,005 | 844 | 6.96% |
| Dunn County | 800 | 974 | 818 | 2.24% |
| Eau Claire County | 899 | 1,081 | 908 | 0.97% |
| Florence County | 520 | 577 | 485 | -6.82% |
| Fond du Lac County | 904 | 1,101 | 925 | 2.27% |
| Forest County | 602 | 689 | 579 | -3.89% |
| Grant County | 710 | 846 | 710 | 0.06% |
| Green County | 810 | 980 | 823 | 1.60% |
| Green Lake County | 775 | 940 | 789 | 1.85% |
| Iowa County | 889 | 1,032 | 867 | -2.52% |
| Iron County | 571 | 707 | 594 | 3.97% |
| Jackson County | 858 | 943 | 792 | -7.71% |
| Jefferson County | 810 | 991 | 832 | 2.74% |
| Juneau County | 754 | 922 | 774 | 2.68% |
| Kenosha County | 852 | 1,075 | 903 | 5.95% |
| Kewaunee County | 779 | 921 | 773 | -0.72% |
| La Crosse County | 884 | 1,085 | 911 | 3.07% |
| Lafayette County | 712 | 952 | 799 | 12.28% |
| Langlade County | 693 | 849 | 713 | 2.87% |
| Lincoln County | 797 | 959 | 805 | 1.04% |
| Manitowoc County | 831 | 1,002 | 841 | 1.25% |
| Marathon County | 920 | 1,104 | 927 | 0.77% |
| Marinette County | 827 | 1,002 | 841 | 1.74% |
| Marquette County | 758 | 856 | 719 | -5.17% |
| Menominee County | 299 | 688 | 578 | 93.22% |
| Milwaukee County | 1,057 | 1,276 | 1071 | 1.37% |
| Monroe County | 785 | 954 | 801 | 2.05% |
| Oconto County | 692 | 872 | 732 | 5.81% |
| Oneida County | 798 | 999 | 839 | 5.12% |
| Outagamie County | 955 | 1,156 | 971 | 1.65% |
| Ozaukee County | 936 | 1,126 | 946 | 1.02% |
| Pepin County | 777 | 973 | 817 | 5.15% |
| Pierce County | 695 | 868 | 729 | 4.87% |
| Polk County | 739 | 907 | 762 | 3.06% |
| Portage County | 871 | 1,059 | 889 | 2.10% |
| Price County | 753 | 964 | 809 | 7.50% |
| Racine County | 940 | 1,126 | 946 | 0.59% |
| Richland County | 729 | 897 | 753 | 3.32% |
| Rock County | 925 | 1,107 | 930 | 0.49% |
| Rusk County | 706 | 893 | 750 | 6.21% |
| St. Croix County | 841 | 1,058 | 888 | 5.64% |
| Sauk County | 775 | 938 | 788 | 1.63% |
| Sawyer County | 706 | 895 | 752 | 6.45% |
| Shawano County | 668 | 832 | 699 | 4.59% |
| Sheboygan County | 981 | 1,179 | 990 | 0.92% |
| Taylor County | 773 | 930 | 781 | 1.03% |
| Trempealeau County | 837 | 970 | 815 | -2.68% |
| Vernon County | 719 | 900 | 756 | 5.11% |
| Vilas County | 629 | 815 | 684 | 8.80% |
| Walworth County | 751 | 936 | 786 | 4.66% |
| Washburn County | 677 | 816 | 685 | 1.21% |
| Washington County | 905 | 1,098 | 922 | 1.88% |
| Waukesha County | 1,131 | 1,312 | 1102 | -2.59% |
| Waupaca County | 755 | 917 | 770 | 1.99% |
| Waushara County | 671 | 787 | 661 | -1.51% |
| Winnebago County | 1,057 | 1,184 | 994 | -5.94% |
| Wood County | 893 | 1,077 | 904 | 1.27% |