By the numbers
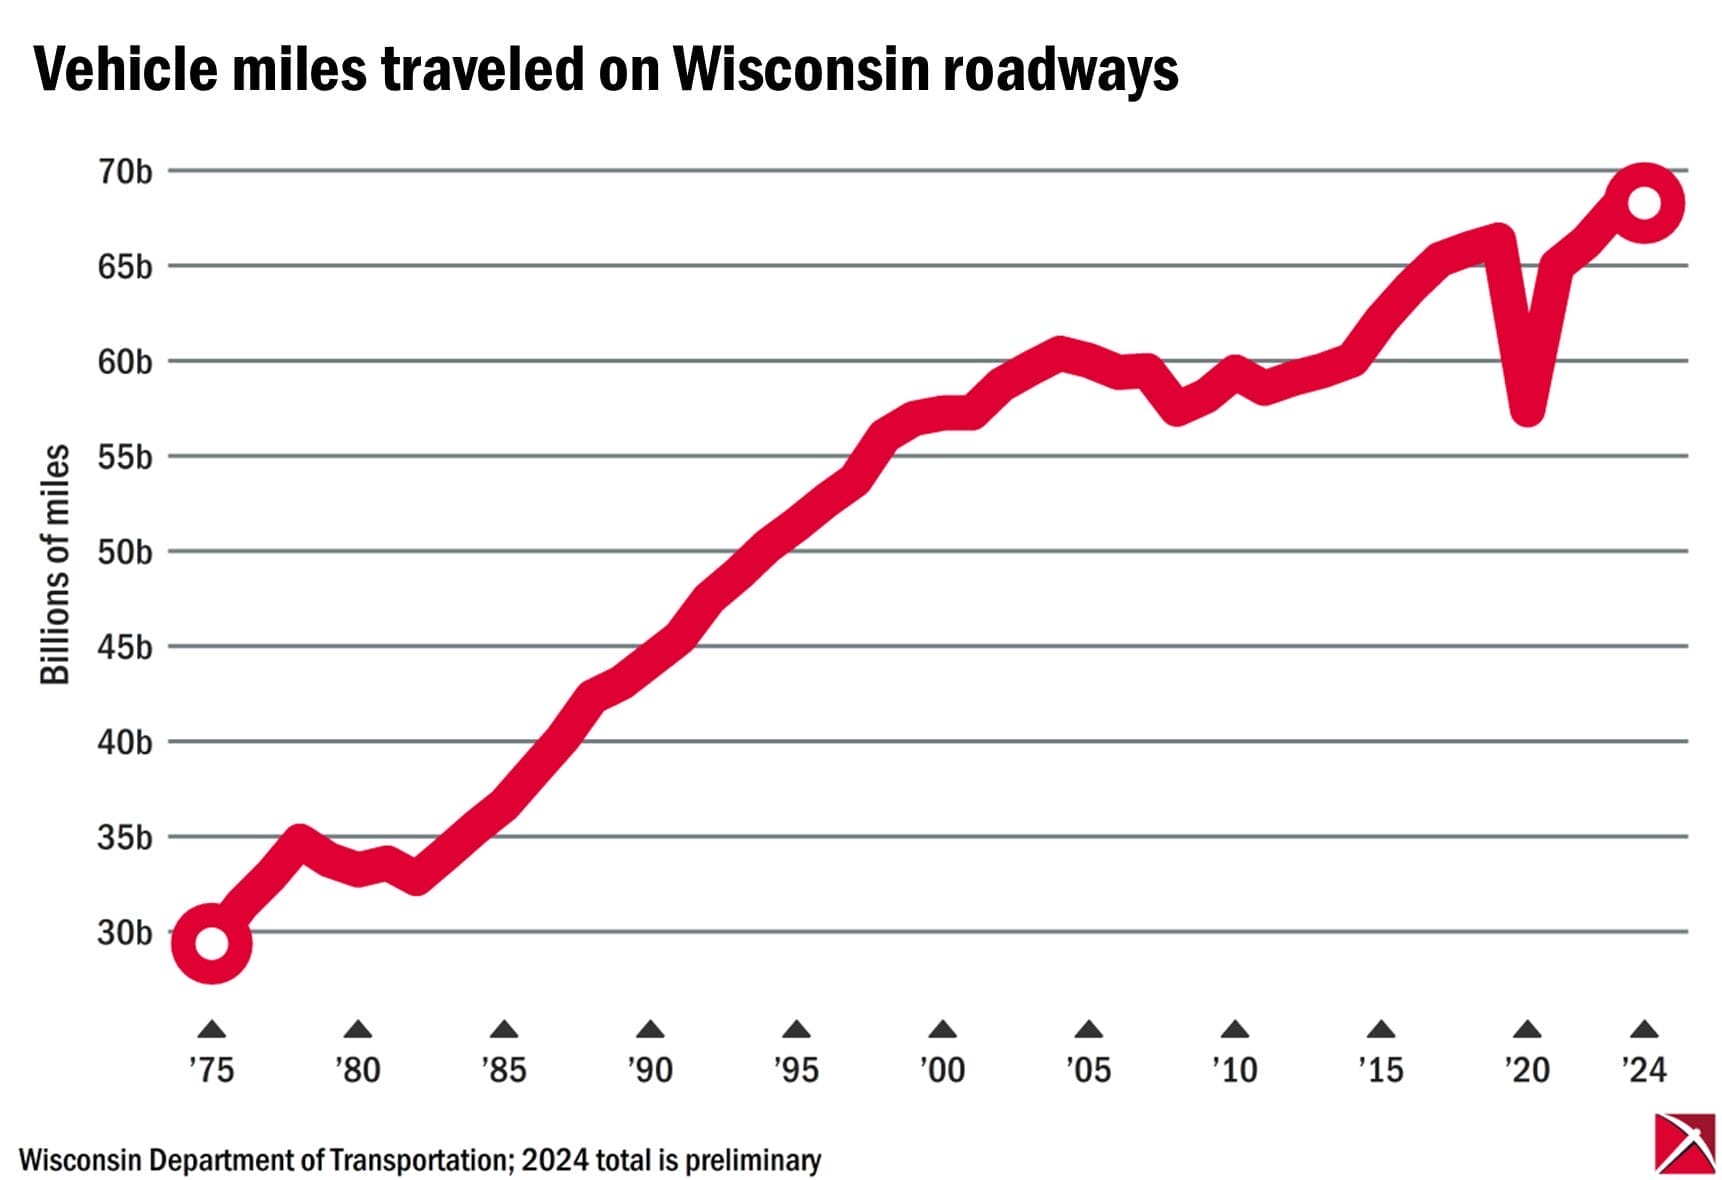
Wisconsin drivers set a record of 68.3 billion miles driven on Wisconsin roadways in 2024, preliminary data from the Wisconsin Department of Transportation and the Federal Highway Administration show.

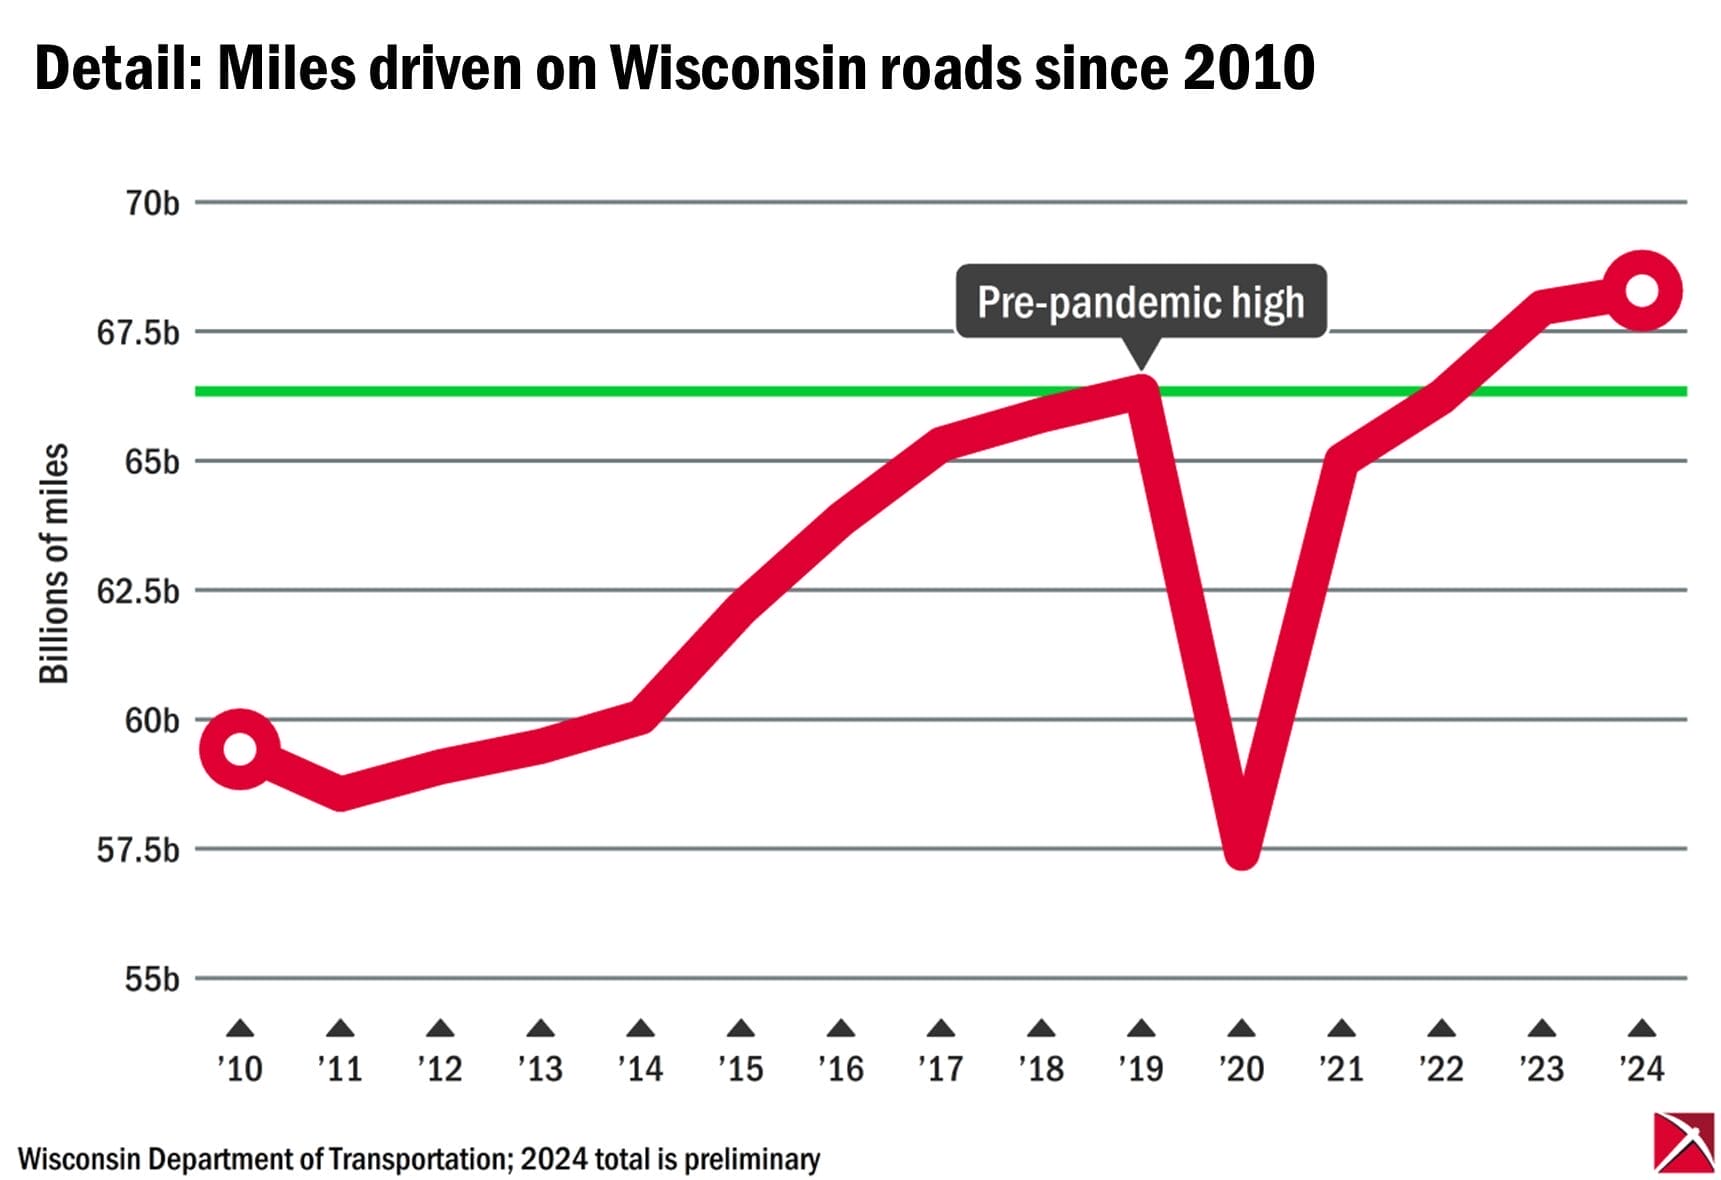
Vehicle-miles of traffic, or VMT, is a measure of all miles driven within an area over a specified period. VMT on Wisconsin roads steadily increased from 32.8 billion miles in 1982 to 60.4 billion miles in 2004, before faltering for about four years. Following the recession, Wisconsin saw generally increasing traffic from 58.2 billion miles in 2009 to a peak of 66.3 billion miles in 2019.

VMT took a dramatic fall in 2020 to just 57.4 billion miles amid COVID-19 lockdowns. By 2022, however, miles driven had nearly returned to their pre-pandemic level, and in both 2023 and 2024, Wisconsin drivers were more mobile than in any previous year.
The Wisconsin DOT tracks mileage figures to provide estimates for road maintenance and to study traffic fatalities. The state estimated that there were a total of 104,120 miles of local roads and 11,746 miles of state highways in 2023.
The underlying numbers
(Vehicle Miles of Traffic in millions)
| Year | State highways VMT | State highways percent change | Local streets VMT | Local streets percent change | All VMT |
| 2024 | N/A | N/A | N/A | N/A | 68,289 |
| 2023 | 38,104 | 2.93 | 29,863 | 2.2 | 67,969 |
| 2022 | 37,020 | 1.88 | 29,220 | 1.93 | 66,240 |
| 2021 | 36,337 | 13.31 | 28,666 | 13.1 | 65,003 |
| 2020 | 32,067 | -15.7 | 25,346 | -10.44 | 57,414 |
| 2019 | 38,040 | -0.81 | 28,301 | 2.79 | 66,341 |
| 2018 | 38,350 | 0.11 | 27,534 | 1.92 | 65,884 |
| 2017 | 38,309 | 2.51 | 27,015 | 4.26 | 65,324 |
| 2016 | 37,372 | 3.15 | 26,498 | 2.27 | 63,870 |
| 2015 | 36,229 | 2.35 | 25,911 | 5.13 | 62,140 |
| 2014 | 35,397 | -0.01 | 24,647 | 2.34 | 60,044 |
| 2013 | 35,400 | -0.45 | 24,084 | 2.36 | 59,484 |
| 2012 | 35,559 | -0.51 | 23,528 | 3.14 | 59,087 |
| 2011 | 35,742 | 0.37 | 22,812 | -4.19 | 58,554 |
| 2010 | 35,610 | -0.81 | 23,810 | 6.98 | 59,420 |
| 2009 | 35,901 | 4.22 | 22,256 | -3.3 | 58,157 |
| 2008 | 34,447 | -2.84 | 23,015 | -4.26 | 57,462 |
| 2007 | 35,454 | 0.91 | 24,039 | -0.93 | 59,493 |
| 2006 | 35,136 | -1.42 | 24,265 | -0.46 | 59,401 |
| 2005 | 35,642 | -1.03 | 24,376 | -0.04 | 60,018 |
| 2004 | 36,013 | 0.98 | 24,385 | 1.8 | 60,398 |
| 2003 | 35,662 | 1.64 | 23,955 | 1.26 | 59,617 |
| 2002 | 35,088 | 2.97 | 23,657 | 2.01 | 58,745 |
| 2001 | 34,076 | -1.68 | 23,190 | 2.57 | 57,266 |
| 2000 | 34,657 | 2.46 | 22,609 | -2.27 | 57,266 |
| 1999 | 33,825 | 1.77 | 23,135 | 1.42 | 56,960 |
| 1998 | 33,236 | 3.59 | 22,812 | 5.39 | 56,048 |
| 1997 | 32,083 | 3.09 | 21,646 | 0.6 | 53,729 |
| 1996 | 31,122 | 3.47 | 21,517 | 0.93 | 52,639 |
| 1995 | 30,077 | 2.97 | 21,318 | 1.21 | 51,395 |
| 1994 | 29,210 | 1.22 | 21,063 | 5.6 | 50,273 |
| 1993 | 28,859 | 2.15 | 19,946 | 3.65 | 48,805 |
| 1992 | 28,252 | 3.14 | 19,243 | 6.52 | 47,495 |
| 1991 | 27,391 | 4.36 | 18,065 | 0.2 | 45,456 |
| 1990 | 26,247 | 3.46 | 18,029 | 1.76 | 44,276 |
| 1989 | 25,370 | 3.34 | 17,717 | -0.38 | 43,087 |
| 1988 | 24,550 | 0.84 | 17,784 | 12.41 | 42,334 |
| 1987 | 24,346 | 5.05 | 15,821 | 3.73 | 40,167 |
| 1986 | 23,176 | 4.82 | 15,252 | 4.68 | 38,428 |
| 1985 | 22,110 | 4.22 | 14,570 | 2.3 | 36,680 |
| 1984 | 21,214 | 1.63 | 14,242 | 7.62 | 35,456 |
| 1983 | 20,873 | 4.07 | 13,234 | 3.89 | 34,107 |
| 1982 | 20,056 | -0.76 | 12,739 | -4.94 | 32,795 |
| 1981 | 20,210 | 4.39 | 13,401 | -3.46 | 33,611 |
| 1980 | 19,360 | -5.11 | 13,881 | 3.74 | 33,241 |
| 1979 | 20,403 | -3.09 | 13,380 | -2.36 | 33,783 |
| 1978 | 21,053 | 7.3 | 13,703 | 3.08 | 34,756 |
| 1977 | 19,621 | 5.74 | 13,294 | 3.57 | 32,915 |
| 1976 | 18,556 | 14.56 | 12,836 | -2.5 | 31,392 |
| 1975 | 16,198 | 13,165 | 29,363 |
Submit a comment
"*" indicates required fields


