By the numbers
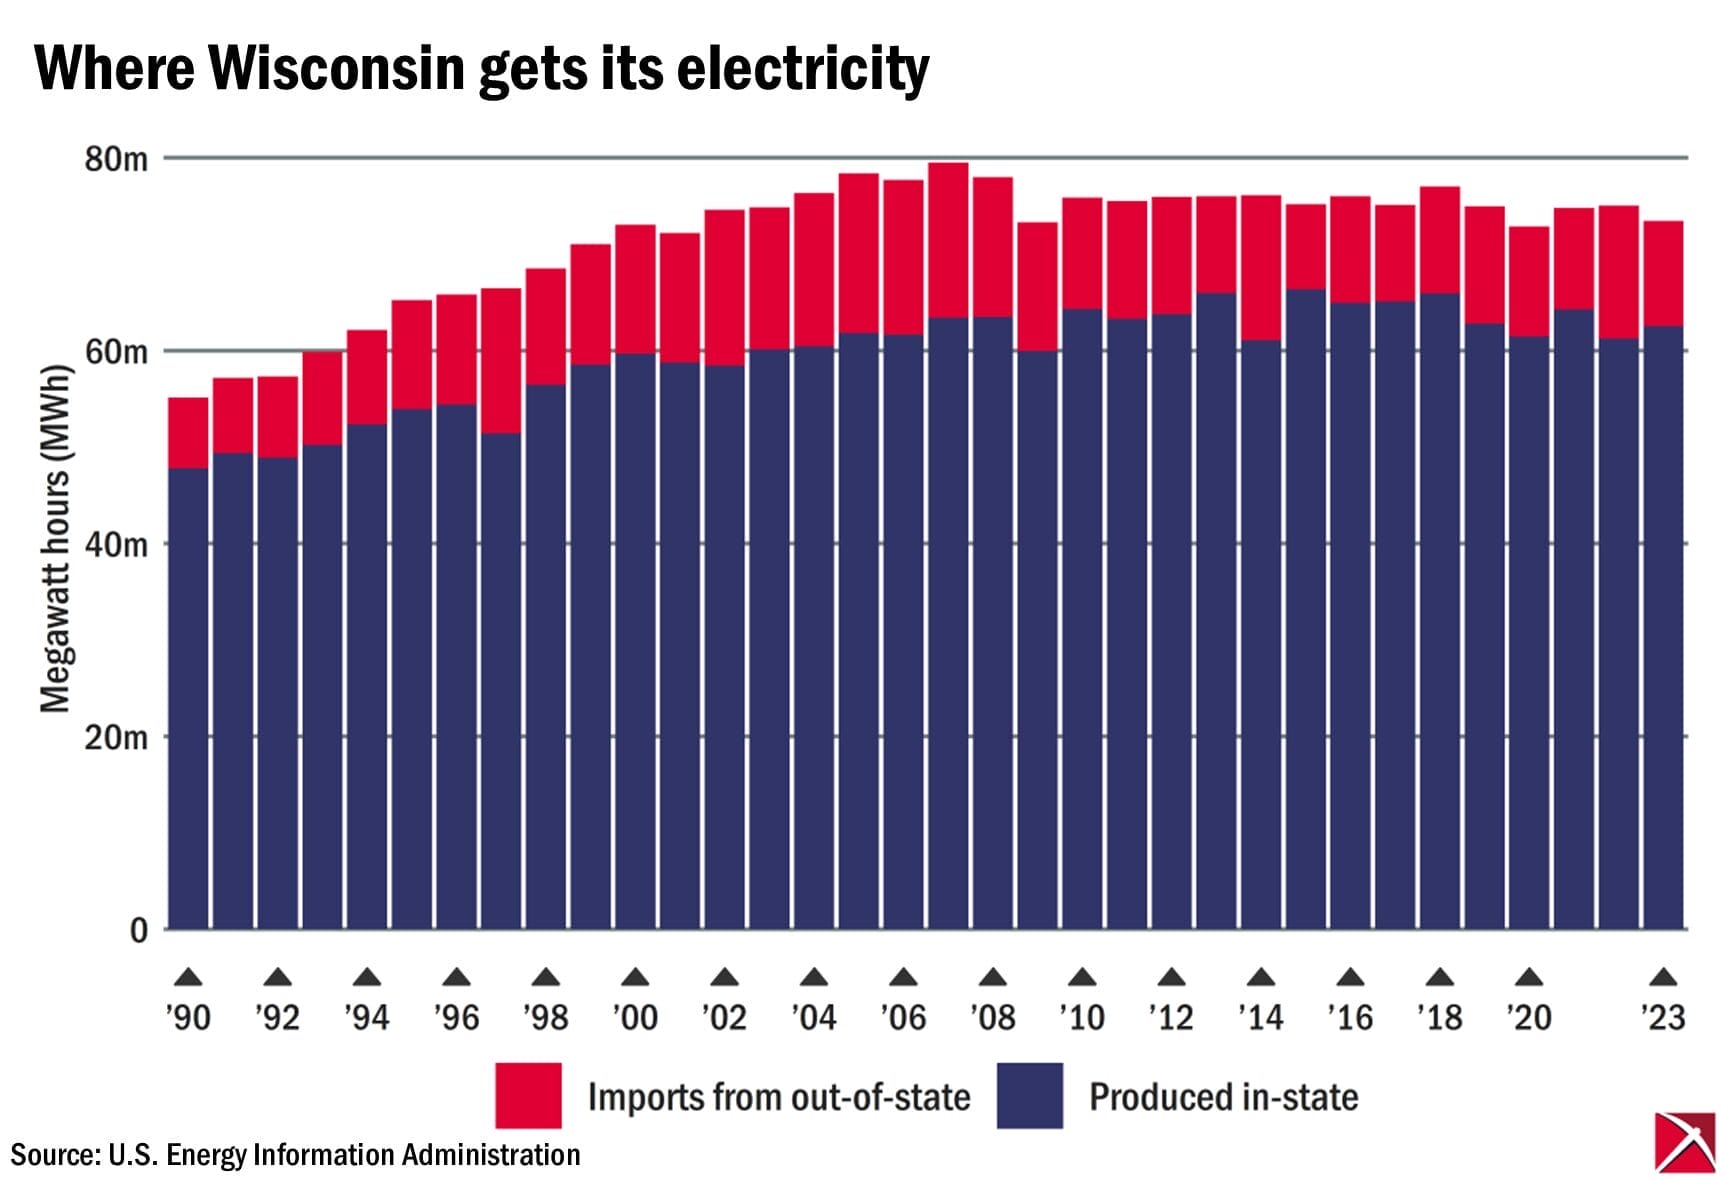
Wisconsin imports over 10 million megawatt-hours (MWh) of energy per year from out-of-state sources, figures from the U.S. Energy Information Administration show, or nearly 15% of the electricity Wisconsinites use.
In 2023, for example, Wisconsin produced 62.5 million MWh internally while importing 10.9 million MWh. The share of Wisconsin’s electricity that is imported has stayed fairly constant since 2008, ranging from 14% to 18% in most years.

Internally, most of Wisconsin’s electricity in 2023 came from coal (21 million MWh) and natural gas (25.6 million MWh). Nuclear energy contributed another 9.7 million MWh. Another 1.9 million MWh came from hydroelectric dams, followed by 1.7 million MWh from wind and 1.3 million MWh from solar.
Wisconsin imports electricity via “the grid,” the interconnected transmission lines owned by electric utilities and independent transmission companies. The flow of power is managed by regional transmission organizations. The one covering Wisconsin and much of the Midwest is the Midcontinent Independent System Operator or MISO.
The underlying numbers
| Category | Total net generation | Total international imports | Net interstate imports | Imported supply by pct | Total supply |
| 1990 | 47,768,856 | 0 | 7,348,237 | 13.33% | 55,117,093 |
| 1991 | 49,356,736 | 0 | 7,802,914 | 13.65% | 57,159,650 |
| 1992 | 48,893,398 | 0 | 8,415,097 | 14.68% | 57,308,495 |
| 1993 | 50,238,552 | 0 | 9,652,845 | 16.12% | 59,891,397 |
| 1994 | 52,358,955 | 0 | 9,790,455 | 15.75% | 62,149,410 |
| 1995 | 53,923,131 | 0 | 11,327,915 | 17.36% | 65,251,046 |
| 1996 | 54,417,739 | 163,471 | 11,405,855 | 17.28% | 65,987,065 |
| 1997 | 51,414,009 | 878,428 | 15,062,186 | 22.36% | 67,354,623 |
| 1998 | 56,447,431 | 840,008 | 12,067,833 | 17.40% | 69,355,272 |
| 1999 | 58,538,851 | 402,581 | 12,513,742 | 17.51% | 71,455,174 |
| 2000 | 59,644,419 | 0 | 13,394,358 | 18.34% | 73,038,777 |
| 2001 | 58,763,433 | 0 | 13,416,267 | 18.59% | 72,179,700 |
| 2002 | 58,431,438 | 0 | 16,164,635 | 21.67% | 74,596,073 |
| 2003 | 60,122,425 | 920 | 14,745,353 | 19.69% | 74,868,698 |
| 2004 | 60,444,933 | 0 | 15,871,347 | 20.80% | 76,316,280 |
| 2005 | 61,824,664 | 68 | 16,571,114 | 21.14% | 78,395,846 |
| 2006 | 61,639,843 | 34 | 16,050,592 | 20.66% | 77,690,469 |
| 2007 | 63,390,630 | 80 | 16,114,283 | 20.27% | 79,504,993 |
| 2008 | 63,479,555 | 0 | 14,492,190 | 18.59% | 77,971,745 |
| 2009 | 59,959,060 | 0 | 13,344,578 | 18.20% | 73,303,638 |
| 2010 | 64,314,067 | 0 | 11,535,663 | 15.21% | 75,849,730 |
| 2011 | 63,289,344 | 0 | 12,212,738 | 16.18% | 75,502,082 |
| 2012 | 63,750,938 | 0 | 12,179,194 | 16.04% | 75,930,132 |
| 2013 | 65,962,792 | 0 | 10,047,247 | 13.22% | 76,010,039 |
| 2014 | 61,064,796 | 0 | 15,064,515 | 19.79% | 76,129,311 |
| 2015 | 66,360,183 | 0 | 8,804,648 | 11.71% | 75,164,831 |
| 2016 | 64,966,611 | 0 | 11,051,835 | 14.54% | 76,018,446 |
| 2017 | 65,107,333 | 0 | 10,008,508 | 13.32% | 75,115,841 |
| 2018 | 65,936,803 | 0 | 11,064,219 | 14.37% | 77,001,022 |
| 2019 | 62,774,299 | 0 | 12,176,609 | 16.25% | 74,950,908 |
| 2020 | 61,448,545 | 0 | 11,419,087 | 15.67% | 72,867,632 |
| 2021 | 64,276,480 | 0 | 10,499,729 | 14.04% | 74,776,209 |
| 2022 | 61,244,310 | 0 | 13,794,933 | 18.38% | 75,039,243 |
| 2023 | 62,548,705 | 0 | 10,891,250 | 14.83% | 73,439,955 |
Submit a comment
"*" indicates required fields


