By the numbers
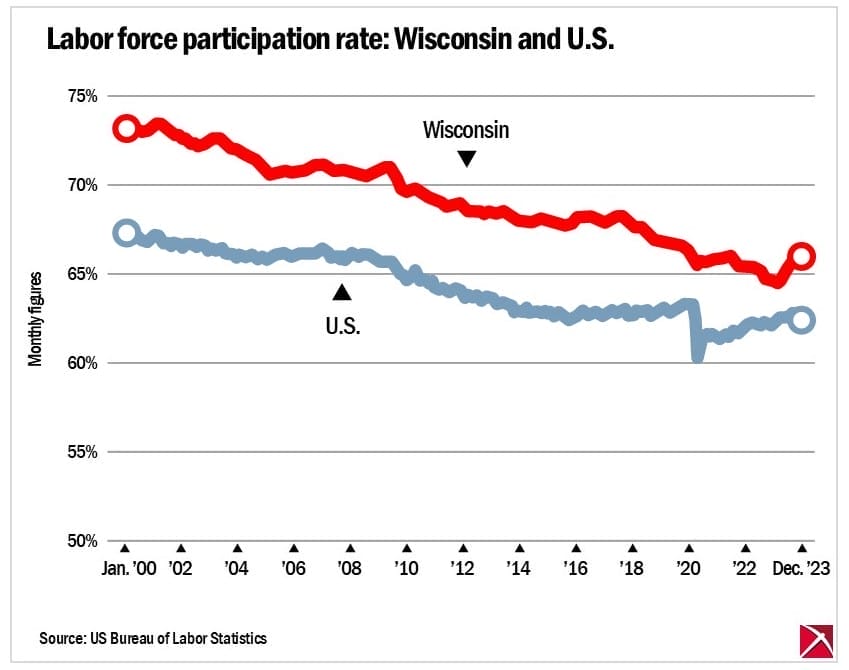
Wisconsin’s labor force participation rate — the share of the state’s civilian, non-institutionalized population 16 and older who are either employed or looking for work — has long been a distinctive feature, consistently surpassing the national average.
That it is above the national average signifies a robust and active workforce in Wisconsin. However, Wisconsin’s rate, like that of the nation, has been falling in the long term since a peak around the turn of the century.
And among “prime age workers” — those aged 25 to 54 — the rate has been falling in Wisconsin since around 2016.

The timeframe differs between the two graphs because of differing availability of data. The U.S. Bureau of Labor Statistics tracks overall labor force participation for the nation and the state on a monthly basis, while figures on age-related subgroups at the state level are available only on an annual basis from the agency, and the 2023 figure is not yet available. Labor force participation includes both employed and unemployed people, with “unemployed” meaning an individual is not working, is available for work and has made at least one active effort to find a job in a four-week period.
The Badger Institute has published several pieces regarding Wisconsin’s workforce:
An article by Angela Rachidi, detailing how rolling back expanded government aid could positively impact the state’s labor shortage.
An article by Ken Wysocky, explaining how the labor shortage could come from a minority education gap.
A report produced by Badger that offers a blueprint for increasing the labor force participation in Wisconsin.
A detailed piece by Mike Nichols about how labor is battling public sentiment in a new economic era.
The underlying numbers
| Date | LFPR for WI | LFPR for U.S. |
| Jan. 2000 | 73.1% | 67.3% |
| Feb. 2000 | 73.2% | 67.3% |
| March 2000 | 73.2% | 67.3% |
| April 2000 | 73.2% | 67.3% |
| May 2000 | 73.1% | 67.1% |
| June 2000 | 73.1% | 67.1% |
| July 2000 | 73.0% | 66.9% |
| Aug. 2000 | 73.0% | 66.9% |
| Sep. 2000 | 73.0% | 66.9% |
| Oct. 2000 | 73.0% | 66.8% |
| Nov. 2000 | 73.1% | 66.9% |
| Dec. 2000 | 73.2% | 67.0% |
| Jan. 2001 | 73.3% | 67.2% |
| Feb. 2001 | 73.4% | 67.1% |
| March 2001 | 73.4% | 67.2% |
| April 2001 | 73.4% | 66.9% |
| May 2001 | 73.3% | 66.7% |
| June 2001 | 73.2% | 66.7% |
| July 2001 | 73.1% | 66.8% |
| Aug. 2001 | 73.0% | 66.5% |
| Sep. 2001 | 72.9% | 66.8% |
| Oct. 2001 | 72.8% | 66.7% |
| Nov. 2001 | 72.8% | 66.7% |
| Dec. 2001 | 72.7% | 66.7% |
| Jan. 2002 | 72.6% | 66.5% |
| Feb. 2002 | 72.6% | 66.8% |
| March 2002 | 72.5% | 66.6% |
| April 2002 | 72.4% | 66.7% |
| May 2002 | 72.3% | 66.7% |
| June 2002 | 72.3% | 66.6% |
| July 2002 | 72.2% | 66.5% |
| Aug. 2002 | 72.2% | 66.6% |
| Sep. 2002 | 72.2% | 66.7% |
| Oct. 2002 | 72.3% | 66.6% |
| Nov. 2002 | 72.3% | 66.4% |
| Dec. 2002 | 72.4% | 66.3% |
| Jan. 2003 | 72.5% | 66.4% |
| Feb. 2003 | 72.6% | 66.4% |
| March 2003 | 72.6% | 66.3% |
| April 2003 | 72.6% | 66.4% |
| May 2003 | 72.6% | 66.4% |
| June 2003 | 72.4% | 66.5% |
| July 2003 | 72.3% | 66.2% |
| Aug. 2003 | 72.2% | 66.1% |
| Sep. 2003 | 72.1% | 66.1% |
| Oct. 2003 | 72.0% | 66.1% |
| Nov. 2003 | 72.0% | 66.1% |
| Dec. 2003 | 72.0% | 65.9% |
| Jan. 2004 | 71.9% | 66.1% |
| Feb. 2004 | 71.8% | 66.0% |
| March 2004 | 71.8% | 66.0% |
| April 2004 | 71.7% | 65.9% |
| May 2004 | 71.6% | 66.0% |
| June 2004 | 71.5% | 66.1% |
| July 2004 | 71.5% | 66.1% |
| Aug. 2004 | 71.4% | 66.0% |
| Sep. 2004 | 71.2% | 65.8% |
| Oct. 2004 | 71.1% | 65.9% |
| Nov. 2004 | 70.9% | 66.0% |
| Dec. 2004 | 70.8% | 65.9% |
| Jan. 2005 | 70.7% | 65.8% |
| Feb. 2005 | 70.6% | 65.9% |
| March 2005 | 70.6% | 65.9% |
| April 2005 | 70.6% | 66.1% |
| May 2005 | 70.6% | 66.1% |
| June 2005 | 70.7% | 66.1% |
| July 2005 | 70.7% | 66.1% |
| Aug. 2005 | 70.8% | 66.2% |
| Sep. 2005 | 70.8% | 66.1% |
| Oct. 2005 | 70.7% | 66.1% |
| Nov. 2005 | 70.7% | 66.0% |
| Dec. 2005 | 70.7% | 66.0% |
| Jan. 2006 | 70.7% | 66.0% |
| Feb. 2006 | 70.7% | 66.1% |
| March 2006 | 70.7% | 66.2% |
| April 2006 | 70.8% | 66.1% |
| May 2006 | 70.8% | 66.1% |
| June 2006 | 70.9% | 66.2% |
| July 2006 | 71.0% | 66.1% |
| Aug. 2006 | 71.0% | 66.2% |
| Sep. 2006 | 71.1% | 66.1% |
| Oct. 2006 | 71.1% | 66.2% |
| Nov. 2006 | 71.1% | 66.3% |
| Dec. 2006 | 71.1% | 66.4% |
| Jan. 2007 | 71.1% | 66.4% |
| Feb. 2007 | 71.0% | 66.3% |
| March 2007 | 71.0% | 66.2% |
| April 2007 | 70.9% | 65.9% |
| May 2007 | 70.8% | 66.0% |
| June 2007 | 70.8% | 66.0% |
| July 2007 | 70.8% | 66.0% |
| Aug. 2007 | 70.8% | 65.8% |
| Sep. 2007 | 70.8% | 66.0% |
| Oct. 2007 | 70.8% | 65.8% |
| Nov. 2007 | 70.7% | 66.0% |
| Dec. 2007 | 70.7% | 66.0% |
| Jan. 2008 | 70.7% | 66.2% |
| Feb. 2008 | 70.6% | 66.0% |
| March 2008 | 70.6% | 66.1% |
| April 2008 | 70.6% | 65.9% |
| May 2008 | 70.5% | 66.1% |
| June 2008 | 70.5% | 66.1% |
| July 2008 | 70.5% | 66.1% |
| Aug. 2008 | 70.6% | 66.1% |
| Sep. 2008 | 70.6% | 66.0% |
| Oct. 2008 | 70.7% | 66.0% |
| Nov. 2008 | 70.8% | 65.9% |
| Dec. 2008 | 70.8% | 65.8% |
| Jan. 2009 | 70.9% | 65.7% |
| Feb. 2009 | 70.9% | 65.8% |
| March 2009 | 71.0% | 65.6% |
| April 2009 | 71.0% | 65.7% |
| May 2009 | 71.0% | 65.7% |
| June 2009 | 70.8% | 65.7% |
| July 2009 | 70.6% | 65.5% |
| Aug. 2009 | 70.4% | 65.4% |
| Sep. 2009 | 70.1% | 65.1% |
| Oct. 2009 | 69.8% | 65.0% |
| Nov. 2009 | 69.7% | 65.0% |
| Dec. 2009 | 69.6% | 64.6% |
| Jan. 2010 | 69.7% | 64.8% |
| Feb. 2010 | 69.7% | 64.9% |
| March 2010 | 69.7% | 64.9% |
| April 2010 | 69.8% | 65.2% |
| May 2010 | 69.7% | 64.9% |
| June 2010 | 69.6% | 64.6% |
| July 2010 | 69.5% | 64.6% |
| Aug. 2010 | 69.4% | 64.7% |
| Sep. 2010 | 69.3% | 64.6% |
| Oct. 2010 | 69.3% | 64.4% |
| Nov. 2010 | 69.2% | 64.6% |
| Dec. 2010 | 69.2% | 64.3% |
| Jan. 2011 | 69.1% | 64.2% |
| Feb. 2011 | 69.0% | 64.1% |
| March 2011 | 69.0% | 64.2% |
| April 2011 | 68.9% | 64.2% |
| May 2011 | 68.8% | 64.1% |
| June 2011 | 68.8% | 64.0% |
| July 2011 | 68.8% | 64.0% |
| Aug. 2011 | 68.9% | 64.1% |
| Sep. 2011 | 68.9% | 64.2% |
| Oct. 2011 | 68.9% | 64.1% |
| Nov. 2011 | 68.9% | 64.1% |
| Dec. 2011 | 68.8% | 64.0% |
| Jan. 2012 | 68.7% | 63.7% |
| Feb. 2012 | 68.6% | 63.8% |
| March 2012 | 68.6% | 63.8% |
| April 2012 | 68.5% | 63.7% |
| May 2012 | 68.5% | 63.7% |
| June 2012 | 68.5% | 63.8% |
| July 2012 | 68.5% | 63.7% |
| Aug. 2012 | 68.5% | 63.5% |
| Sep. 2012 | 68.4% | 63.6% |
| Oct. 2012 | 68.5% | 63.8% |
| Nov. 2012 | 68.5% | 63.6% |
| Dec. 2012 | 68.5% | 63.7% |
| Jan. 2013 | 68.4% | 63.7% |
| Feb. 2013 | 68.4% | 63.4% |
| March 2013 | 68.4% | 63.3% |
| April 2013 | 68.5% | 63.4% |
| May 2013 | 68.5% | 63.4% |
| June 2013 | 68.5% | 63.4% |
| July 2013 | 68.4% | 63.3% |
| Aug. 2013 | 68.3% | 63.3% |
| Sep. 2013 | 68.2% | 63.2% |
| Oct. 2013 | 68.1% | 62.8% |
| Nov. 2013 | 68.0% | 63.0% |
| Dec. 2013 | 68.0% | 62.9% |
| Jan. 2014 | 68.0% | 62.9% |
| Feb. 2014 | 68.0% | 62.9% |
| March 2014 | 68.0% | 63.1% |
| April 2014 | 67.9% | 62.8% |
| May 2014 | 67.9% | 62.9% |
| June 2014 | 67.9% | 62.8% |
| July 2014 | 68.0% | 62.9% |
| Aug. 2014 | 68.0% | 62.9% |
| Sep. 2014 | 68.1% | 62.8% |
| Oct. 2014 | 68.1% | 62.9% |
| Nov. 2014 | 68.0% | 62.9% |
| Dec. 2014 | 68.0% | 62.8% |
| Jan. 2015 | 67.9% | 62.9% |
| Feb. 2015 | 67.9% | 62.7% |
| March 2015 | 67.9% | 62.6% |
| April 2015 | 67.8% | 62.8% |
| May 2015 | 67.8% | 62.9% |
| June 2015 | 67.8% | 62.7% |
| July 2015 | 67.7% | 62.6% |
| Aug. 2015 | 67.7% | 62.6% |
| Sep. 2015 | 67.8% | 62.4% |
| Oct. 2015 | 67.8% | 62.5% |
| Nov. 2015 | 67.9% | 62.5% |
| Dec. 2015 | 68.1% | 62.7% |
| Jan. 2016 | 68.2% | 62.7% |
| Feb. 2016 | 68.2% | 62.8% |
| March 2016 | 68.2% | 63.0% |
| April 2016 | 68.2% | 62.9% |
| May 2016 | 68.2% | 62.7% |
| June 2016 | 68.2% | 62.7% |
| July 2016 | 68.2% | 62.8% |
| Aug. 2016 | 68.1% | 62.9% |
| Sep. 2016 | 68.1% | 62.9% |
| Oct. 2016 | 68.0% | 62.8% |
| Nov. 2016 | 68.0% | 62.7% |
| Dec. 2016 | 67.9% | 62.7% |
| Jan. 2017 | 67.9% | 62.8% |
| Feb. 2017 | 68.0% | 62.9% |
| March 2017 | 68.0% | 62.9% |
| April 2017 | 68.1% | 63.0% |
| May 2017 | 68.2% | 62.8% |
| June 2017 | 68.2% | 62.8% |
| July 2017 | 68.2% | 62.9% |
| Aug. 2017 | 68.2% | 62.9% |
| Sep. 2017 | 68.1% | 63.1% |
| Oct. 2017 | 68.0% | 62.7% |
| Nov. 2017 | 67.8% | 62.7% |
| Dec. 2017 | 67.8% | 62.7% |
| Jan. 2018 | 67.6% | 62.7% |
| Feb. 2018 | 67.6% | 63.0% |
| March 2018 | 67.6% | 62.9% |
| April 2018 | 67.6% | 62.9% |
| May 2018 | 67.5% | 62.9% |
| June 2018 | 67.4% | 63.0% |
| July 2018 | 67.3% | 63.0% |
| Aug. 2018 | 67.1% | 62.6% |
| Sep. 2018 | 67.0% | 62.8% |
| Oct. 2018 | 66.9% | 62.9% |
| Nov. 2018 | 66.9% | 62.9% |
| Dec. 2018 | 66.8% | 63.0% |
| Jan. 2019 | 66.8% | 63.1% |
| Feb. 2019 | 66.8% | 63.1% |
| March 2019 | 66.8% | 63.0% |
| April 2019 | 66.7% | 62.8% |
| May 2019 | 66.7% | 62.9% |
| June 2019 | 66.7% | 63.0% |
| July 2019 | 66.7% | 63.1% |
| Aug. 2019 | 66.6% | 63.1% |
| Sep. 2019 | 66.6% | 63.2% |
| Oct. 2019 | 66.5% | 63.3% |
| Nov. 2019 | 66.4% | 63.3% |
| Dec. 2019 | 66.3% | 63.3% |
| Jan. 2020 | 66.1% | 63.3% |
| Feb. 2020 | 65.9% | 63.3% |
| March 2020 | 65.6% | 62.6% |
| April 2020 | 65.5% | 60.1% |
| May 2020 | 65.8% | 60.8% |
| June 2020 | 65.6% | 61.5% |
| July 2020 | 65.8% | 61.5% |
| Aug. 2020 | 65.6% | 61.7% |
| Sep. 2020 | 65.8% | 61.5% |
| Oct. 2020 | 65.8% | 61.7% |
| Nov. 2020 | 65.8% | 61.5% |
| Dec. 2020 | 65.9% | 61.5% |
| Jan. 2021 | 65.8% | 61.3% |
| Feb. 2021 | 65.9% | 61.4% |
| March 2021 | 65.9% | 61.5% |
| April 2021 | 66.0% | 61.6% |
| May 2021 | 66.0% | 61.5% |
| June 2021 | 66.0% | 61.7% |
| July 2021 | 65.9% | 61.8% |
| Aug. 2021 | 65.7% | 61.8% |
| Sep. 2021 | 65.5% | 61.7% |
| Oct. 2021 | 65.4% | 61.8% |
| Nov. 2021 | 65.4% | 61.9% |
| Dec. 2021 | 65.4% | 62.0% |
| Jan. 2022 | 65.4% | 62.2% |
| Feb. 2022 | 65.4% | 62.2% |
| March 2022 | 65.4% | 62.3% |
| April 2022 | 65.4% | 62.2% |
| May 2022 | 65.3% | 62.3% |
| June 2022 | 65.2% | 62.2% |
| July 2022 | 65.0% | 62.1% |
| Aug. 2022 | 64.8% | 62.4% |
| Sep. 2022 | 64.7% | 62.3% |
| Oct. 2022 | 64.6% | 62.3% |
| Nov. 2022 | 64.6% | 62.1% |
| Dec. 2022 | 64.6% | 62.3% |
| Jan. 2023 | 64.5% | 62.4% |
| Feb. 2023 | 64.5% | 62.5% |
| March 2023 | 64.6% | 62.6% |
| April 2023 | 64.8% | 62.6% |
| May 2023 | 65.1% | 62.6% |
| June 2023 | 65.3% | 62.6% |
| July 2023 | 65.5% | 62.6% |
| Aug. 2023 | 65.7% | 62.8% |
| Sep. 2023 | 65.8% | 62.8% |
| Oct. 2023 | 65.8% | 62.7% |
| Nov. 2023 | 65.9% | 62.8% |
| Dec. 2023 | 65.9% | 62.5% |
| Year | WI labor force participation rate, 25-54 |
| 2003 | 88.3% |
| 2004 | 88.2% |
| 2005 | 88.2% |
| 2006 | 89.0% |
| 2007 | 88.7% |
| 2008 | 88.5% |
| 2009 | 87.7% |
| 2010 | 87.5% |
| 2011 | 87.6% |
| 2012 | 87.0% |
| 2013 | 86.7% |
| 2014 | 87.4% |
| 2015 | 87.4% |
| 2016 | 89.1% |
| 2017 | 88.4% |
| 2018 | 87.8% |
| 2019 | 87.7% |
| 2020 | 86.3% |
| 2021 | 85.8% |
| 2022 | 84.7% |
Published in the Jan. 26 issue of Top Picks.
